I work on software that depends on high-quality data captured by hardware - mostly drones. That work has made me spend much more time thinking about what happens before the data ever reaches the product: what has to go right at the very beginning of the pipeline for anything useful to come out at the end.
Drones stopped being cameras
When I think about drones, I often still picture a small aircraft that records an image - a photo or a video. That picture is a few years out of date, and the gap between it and reality is what this article is about.
Reality capture - the routine, systematic recording of what a site actually looks like - is becoming a normal part of how construction work is run rather than an experiment on the side. On the projects I see, flights are becoming more frequent and the resulting data is increasingly part of regular project controls. For a sense of scale, the FAA's base forecast puts the registered US commercial drone fleet above one million, though its estimate of the active fleet is substantially lower.
One market estimate puts construction drones at $4.6 billion in 2024, growing to about $7.1 billion by 2030; I'd read a figure like that as a single research house's projection rather than proof of anything. Other research firms put the 2030 figure far higher - roughly $14 billion to $16 billion, depending on scope and base year. I read the spread itself as the honest signal: the firms agree on the direction and disagree, by about two to one, on the size.
There is so much to capture because large projects have a persistent problem: what is built on site gradually diverges from what was planned. McKinsey's benchmark work on large capital projects has long put the average one at roughly 20 months behind schedule and up to 80% over budget. Writing in Harvard Business Review back in 2017, Chris Anderson framed drones as a way to close the gap between "as designed" and "as built" - the gap where change orders, rework, and schedule slips eat into a multi-trillion-dollar industry. The specific numbers he cited have aged, but the mechanism has not, and closing that gap is what the data is for.
Two eras of drones on site
Looking back, I would split the use of drones in construction into two phases, defined by what the drones were for.
In the first phase, drones were a documentation tool. A pilot flew the site at various stages to show, visually, where things stood - but without measurements. The material supported delivery only loosely, and just as often it ended up in marketing decks and sales materials. Useful, but closer to photography than to engineering. (That use has not gone away, and the aerial cinematography on large projects today is genuinely good. It just stopped being the whole story.)
The second phase started when the software around the hardware matured. Vendors added mission planning, including repeatable flight paths - the same route, altitude, and camera settings flight after flight, which is what makes results comparable over time. Then came hardware add-ons, RTK first among them.
RTK stands for Real-Time Kinematic positioning. In plain terms: a standard GPS fix is accurate to a few meters, which is fine for navigation but not sufficient by itself for survey control. RTK refines that fix in real time using a base station or a correction network, bringing position accuracy toward the centimeter level. On a drone, this means each photo can be tagged with a precise position, so the maps and models built from those photos can approach survey-grade accuracy with fewer ground control points on site. "Can," not "will" - and a later section is about why.
On top of positioning came sensors beyond the regular camera: multispectral, thermal, LiDAR. Put together - consistent flight paths, precise positioning, specialized sensors - the industry moved from taking pictures to producing measurements.
The orthophoto workhorse
The most common product of all this is the orthophoto: a large, georeferenced, distortion-corrected image of the site, stitched from hundreds or thousands of photos. With a well-planned flight, the imagery can be as fine as 1 px = 2 cm in my experience. At that resolution you are no longer looking at general shapes; you can pick out individual infrastructure elements, including larger mechanical and electrical components.
That combination of resolution and accurate georeferencing makes several uses practical:
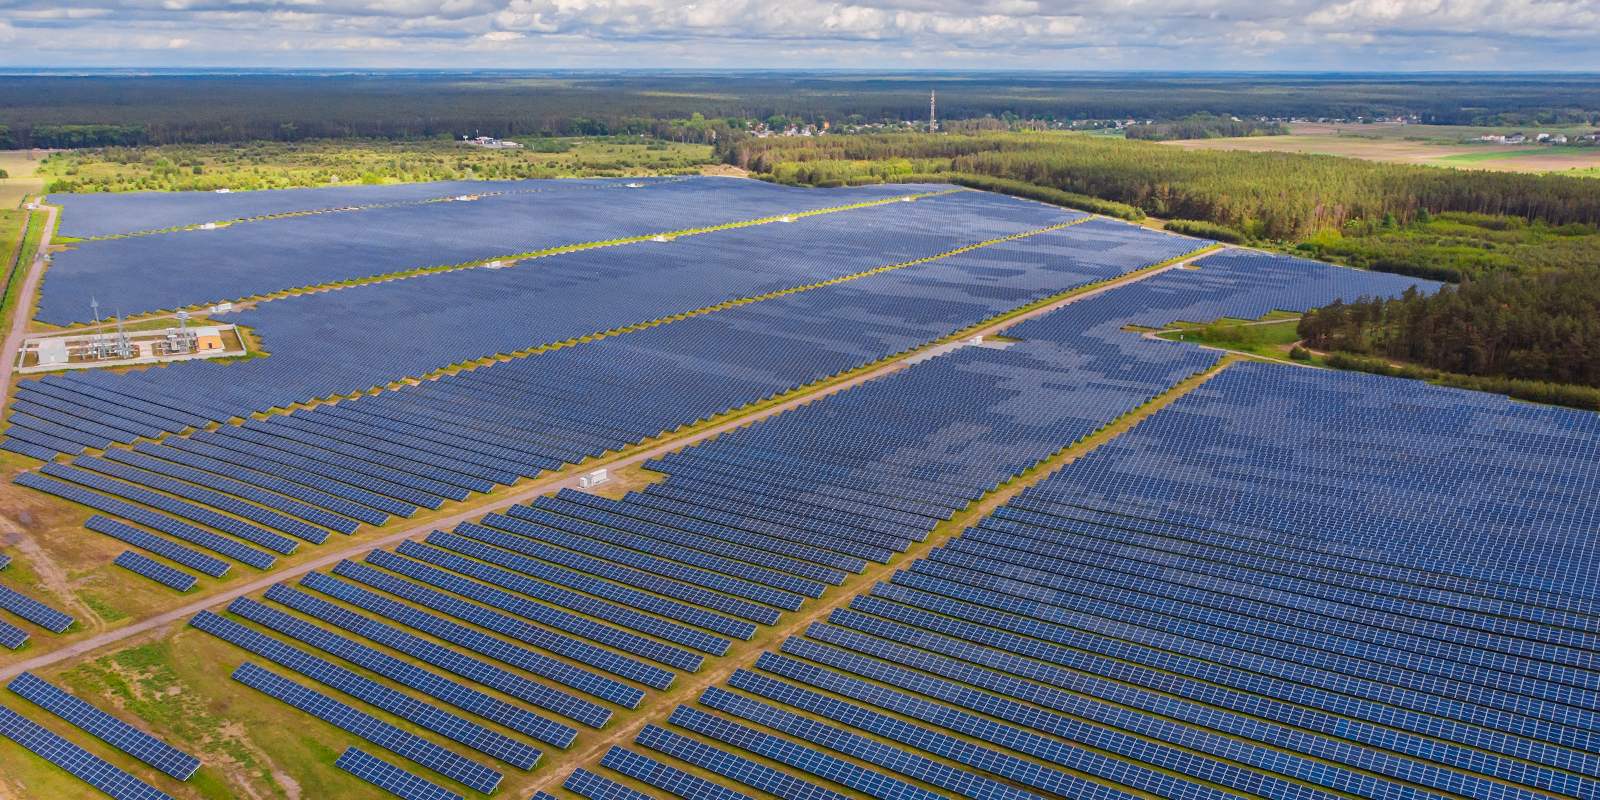
- Progress monitoring. Regular flights over the same area show what was built between one week and the next, element by element. On a solar farm with tens of thousands of panels, you can count what is actually mounted and check whether each row sits where it was supposed to.
- As-built versus as-designed. A georeferenced orthophoto overlaid on the design turns "what was meant to be built" and "what stands on site" into two layers of one map - which is how you catch the classic problems: something built too far over, too close, or on the wrong plot.
- Inspections and deviations. Instead of walking kilometers of site, you review the imagery to spot where reality drifts from the plan and to target where field inspection is needed.
- Health and safety. The same imagery shows site organization - access roads, storage areas, whether things are where the safety plan says they should be - and the occasional surprise, like an excavator that has strayed onto a neighbor's land.
A good model starts before takeoff
So what decides whether a flight produces a usable model? Most of it is settled before the drone leaves the ground.
It starts with the deliverable. You define the output and the accuracy it needs, then plan backwards: ground sample distance (how many centimeters each pixel represents), flight altitude, image overlap, and whether the job needs straight-down (nadir) shots, oblique angles, or both. Weather decides much of the rest - wind, low light, and anything that introduces motion blur degrade the result no matter how capable the aircraft is.
Then comes positioning and control. The data has to sit in the right coordinate system and datum; RTK or PPK positioning has to be valid and verified, with correct base-station or network correction data; and independent check points, surveyed separately, are what let you prove a model's accuracy rather than assume it. Before anyone accepts a model, someone should check coverage, sharpness, and the residual errors - and keep metadata and settings consistent from one mission to the next, or the week-over-week comparison quietly stops being fair.
It helps to keep three things apart, because RTK on its own does not deliver all of them:
- Resolution (GSD) - how much ground a single pixel covers.
- Precision - how consistent repeated measurements are.
- Absolute accuracy - how well the model is anchored to real-world coordinates.
A flight can be sharp and internally consistent yet still sit half a meter off in the real world if the control is wrong. That last property is often the one disputes hinge on, and it is not automatic - it depends on flight geometry, camera calibration, the quality of the corrections, processing, and the control points, not on RTK alone.
This is also why drone measurement does not always replace a surveyor or a formal handover. It narrows the questions, catches problems early, and documents them - but where legal or contractual accuracy is required, it supports the professional rather than retiring them.
LiDAR, vegetation, and heat
Photogrammetry has limits - uniform surfaces, poor light, dense vegetation. LiDAR measures geometry directly, firing laser pulses and timing their return to build a dense 3D point cloud. It is not automatically more accurate than photogrammetry; its advantages are geometric - it works in difficult light and can get some returns through gaps in vegetation to the ground beneath.
On construction projects the classic application is earthworks: volumes of excavations, stockpiles, and embankments - how much material is in a pile, how deep a trench has actually been dug - captured in one flight and repeated as the schedule needs. The value is not only speed; it is the dense sampling of the surface rather than a sparse set of manually selected points.
Two other sensor types show up less often but solve specific problems that regular RGB imagery cannot. Multispectral cameras capture light beyond the visible range, which yields proxy indicators of vegetation condition rather than a direct chemical reading - useful around environmental requirements, where protected greenery must be monitored or replanted areas checked for whether they are taking root.
Thermal sensors read surface temperature and flag anomalies: a solar panel or an electrical component running hotter than its neighbors. A thermal image points you to a spot worth inspecting; it does not, on its own, confirm a leak or a fault. That confirmation is a separate step.
Aerial capture also has physical blind spots. It is strong on site-wide context, earthworks, roofs, and exposed infrastructure, but weaker indoors, under cover, and wherever structures occlude the view. That makes aerial capture useful alongside, rather than instead of, other project records.
- Mission planning
- Capture
- Positioning & QA
- Ortho / model
- AI analysis
- Decision
The software layer
All of the above is capture. What makes capture quality matter is what happens next: analytics software - the category I work in - turns these datasets into answers. Some of that is not AI at all. Stitching photos into an orthophoto, georeferencing it, and reconstructing 3D geometry are photogrammetry, solved with well-understood math. AI typically enters later in the pipeline: detecting and classifying individual elements, segmenting the scene, and comparing one flight against the next to say what changed.
In practice that runs as a pipeline over every new dataset:
- Detect and classify. Automatically find and label the individual objects across the whole site - foundations, structural steel, pipe runs, mounted panels.
- Compare against the plan. Match every element against the design model and the construction schedule, not just against the previous flight.
- Quantify. Report how much of each work type is actually installed, whether it sits where it was meant to, and how that lines up with what the plan expected by that date.
The output is an as-built progress report - percentages and quantities per element type, not "roughly on track" - the kind of thing a project manager can act on in the next site meeting.
This matters particularly at scale. On a small site you could eyeball progress. On a large one you cannot. Combined with validated positioning, the design, and the schedule, that resolution lets you ask whether an individual component was built in the right place and at the right time.
What this changes on a project
The first practical benefit is reporting speed. A mature capture and processing workflow can reduce the reporting lag from weeks to days or even hours. When data captured during a flight is ready for the next site meeting, the team can flag an area where work is behind schedule, a component in the wrong place, a grading issue before the concrete goes down. Errors caught early are generally cheaper to correct; errors caught at handover are not.
The second is agreement. A georeferenced record is closer to an objective source of truth than a verbal status call or a folder of loose photos. When both sides point at the same map instead of trading recollections, the arguments about what was built, where, and when get shorter. That has a downstream effect people underrate: fewer and shorter disputes mean the claims and payments that used to wait on them move faster. Accurate weekly progress data can help a contractor substantiate billing against what is genuinely done and give the client a reason to trust the invoice. On the projects I have seen, this is where the money is - not in the imagery, but in the arguments it prevents.
What comes next
Three hardware trends are worth watching:
- Drone-in-a-box. Docked drones that live on site, fly scheduled missions automatically, recharge, and upload data without a pilot on location, where regulations allow it. This turns reality capture from an event into a background process.
- Sensors and prices. Capability that required a high-end platform a few years ago - LiDAR, thermal, high-resolution cameras - keeps moving into smaller and cheaper hardware. The entry barrier is dropping.
- From aircraft to service. Vendors are building out the environment around the drone, and from where I sit, more of the differentiation is moving into mission planning, fleet management, and data pipelines than into the airframe itself. The drone is becoming less a gadget and more a node in a larger system.
Construction drones are becoming less interesting as flying cameras and more interesting as part of a data pipeline. The aircraft captures the site. The useful part starts when that capture can be reliably compared with the design, schedule and previous state of the project.
Thanks for reading!
Sources
Reports and figures behind the numbers and the chart, followed by the standard technical references for the RTK/GNSS, photogrammetry, and lidar background.
- Chris Anderson, "Drones Go to Work," Harvard Business Review, 2017 - hbr.org (the "as designed" versus "as built" gap).
- McKinsey & Company, "Managing big projects: The lessons of experience" - mckinsey.com (large infrastructure, mining, and oil & gas projects average about 20 months late and 80% over budget).
- FAA Aerospace Forecast, FY2025-2045 (UAS & AAM) - faa.gov (base forecast: registered US commercial fleet above one million; active fleet substantially lower).
- Construction-drone market forecasts (the chart) - Research & Markets (~$7.1B by 2030), Mordor Intelligence (~$14.1B by 2031), The Business Research Company (~$15.25B by 2030), and Straits Research (~$15.8B by 2030).
- NOAA National Geodetic Survey, Continuously Operating Reference Stations (CORS) - geodesy.noaa.gov/CORS (RTK/GNSS positioning and correction networks).
- ASPRS, Positional Accuracy Standards for Digital Geospatial Data - asprs.org/standards (resolution versus precision versus absolute accuracy; ground control and check points).
- USGS 3D Elevation Program (3DEP) - usgs.gov/3d-elevation-program (lidar and 3D point-cloud fundamentals).